
In Process Mapping Basics, we explained why mapping is an excellent way to start your Business Analysis journey, as it allows you to start to understand conceptually how your job functions within the organisation and where it links to other roles and processes.
In order to create your maps, you will likely want to know what tools to use, and that is what we’ll discuss below.
By Hand
The simplest and possibly cheapest way to start Process Mapping is doing so by hand e.g. paper, whiteboard, post it notes. These are all great for low budgets, and quick changes.
The advantages is not only is it a low-exposure way to start practicing your skills, but also can be used to help involve your colleagues when looking to build out how a process runs into other areas.
I have been to a number of excellent workshops where the goal was to get a full picture of a process (also called “End-to-End” or “E2E”) – which tracks a process across a number of staff, teams, and divisions. This was achieved with little more than blank paper/whiteboard and pen or sticky note. Just be aware that they may be some “house-rules” as to what the shapes or colours may mean in your circumstance.
#NotSponsored
A quick disclaimer, I’m not being paid to promote any of the below tools, they are simply a list of applications that I have had the benefit of experiencing. I recommend you try all of them and decide for yourself which solution best suits your need. (+10 Points for Self-Awareness!)
Microsoft Visio
| Pros | Cons |
| Local Install or Web based option Local or cloud saving (OneDrive) Huge Icon Set | Relatively expensive if buying it yourself No decent collaboration options So many features can seem a bit overwhelming |
Honestly, this is the benchmark by which all other Process Mapping tools measure themselves. In my experience, this is the most widely known and trusted and certainly where I started.
There are a wealth of options of icon sets, that can help you beyond basic mapping, to official standardised styles e.g. Lean, Six Sigma, BPMN 2.0 (Business Process Mapping and Notation) – articles on all will be coming soon.
In addition, Visio also includes icon sets for a tonne of other applications from Gantt charts for project management, planning floor layouts, network and infrastructure diagrams, the list goes on.
The downside of Visio is it is often considered expensive, a number of business I have worked for were oddly shy about purchasing, and buying it yourself is less attractive. Thankfully, there is now a monthly subscription option as an add-on to Microsoft O365, which makes it a more attractive option – one that I’m currently considering so that I can provide a full review of features gained.
Diagrams.net (Draw.io)
| Pros | Cons |
| FREE! Web-base application Integrations to save into GoogleDrive, OneDrive, Dropbox, Github Lots of templates for things other than just process maps | You have to save files locally Also you have to save the working file (.drawio / .xml) if you want to edit it later No collaboration options |
Draw.io is a free web-based alternative to Visio, with a great set of icons and templates.
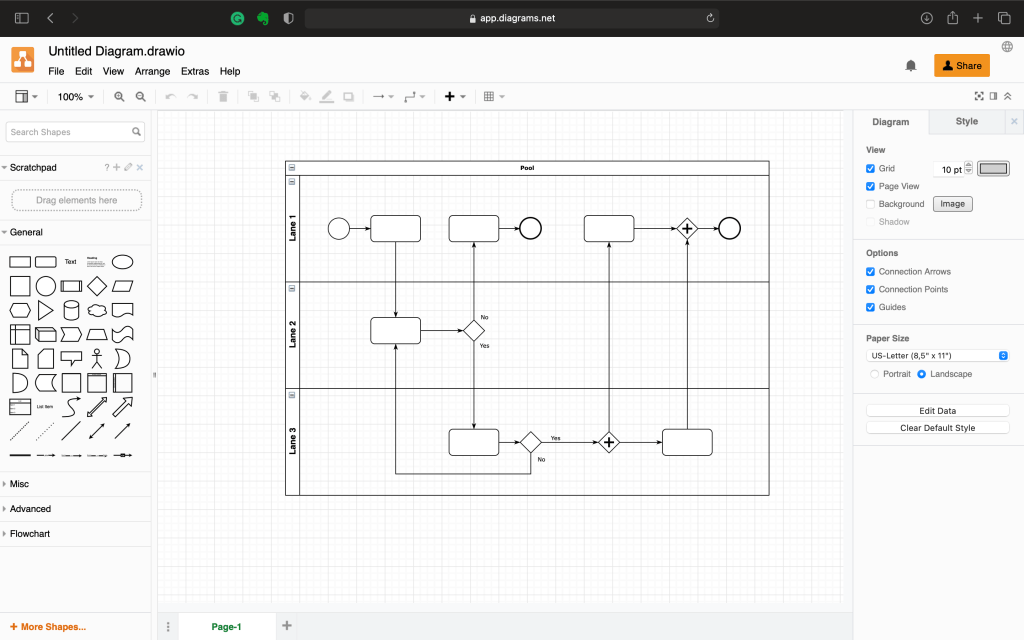
One of its advantages is that it has a great set of icons, and features a long list of templates and icon sets that put up a good fight at competing with Visio as a free alternative.
The main disadvantage, is that you will need to remember to save any work in the editable version, and to Export an image file version. The reason for this is two-fold:
- There is no login for Draw.io, and no cloud storage. In order to keep it free they don’t store a copy of your work
- Because of that, anything you make you need to save to your preferred service whether that is locally on your device, or through another storage service e.g. Google Drive, OneDrive, Dropbox, Git.
LucidChart
| Pros | Cons |
| Freemium (free and paid tiers) Collaboration Cloud storage (limited to 3 ‘drawings’ on free, more if you pay) | Relatively limited icon sets |
LucidChart is a web-based process mapping tool, and one that I’ve used to make all the graphics here. I’ll do a full review in the future once I’ve played with it a bit more.
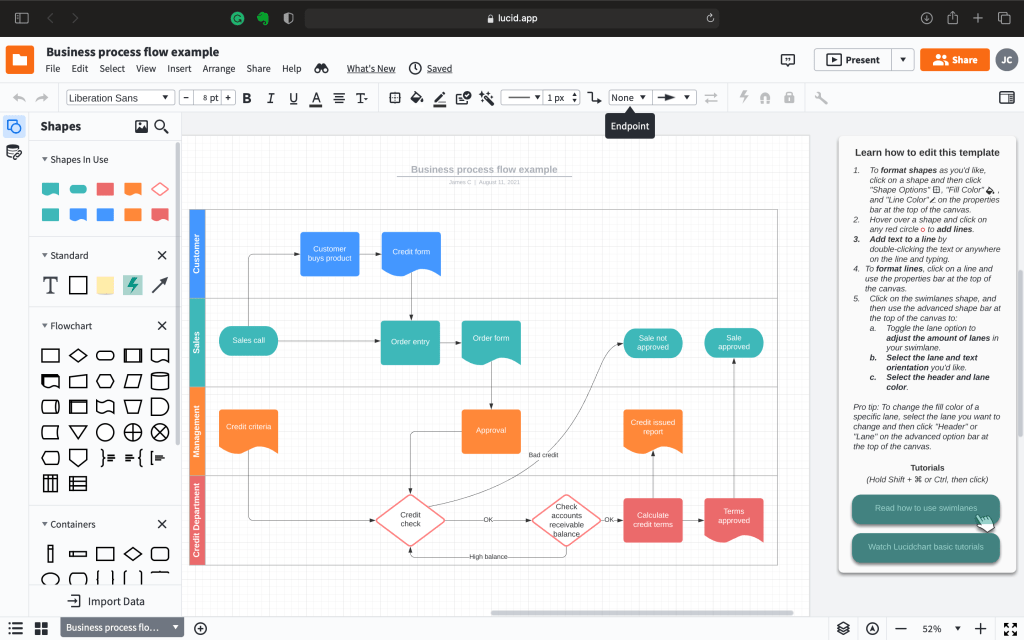
While it doesn’t provide the depth of variety of icon sets compared to Visio (at least in my trial version) it still works very well, with some nice intuitive features such as automatic labelling of arrows coming out of the decision boxes (first is labelled “Yes”, second is labelled “No”).
In A Pinch
In terms of applications that can do Process Mapping, which are readily accessible, but not the primary purpose, the most readily accessible would be the Microsoft Office Suite (Word, Excel, PowerPoint, Publisher), and their Apple counterparts (Pages, Numbers, Keynote).
These applications have Insert -> Shape options which cover the basic shapes, Pill or Circle, Boxes, Diamond, and connective arrows, that will get you most of the way there.
Similarly, you can get fairly far with MS Paint, but I would definitely not recommend it.
Even in MS Paint it is possible to Process Map, but the main limitation of any of these solutions are how “tidy” you can make the maps – and really that’s an essentaial goal when it comes to ensuring that the mapped process can be easily understood by anyone other than yourself.
Special Mention
Lastly, I want to make a special mention for Microsoft Whiteboard, this is both a standalone web-based application, but more importantly, can be integrated to Microsoft Teams.
The advantage of Whiteboard, is that, as the name suggests, it works as a digital whiteboard that can be shared and collaborated on by multiple people at the same time. This is really handy in E2E scenarios, as everyone can either review and comment, or actively modify the map together.
I’ve only had a brief play with it recently, but I’m looking forward to getting more familiar with it in the coming months.

Leave a comment