
Previously we discussed that best ways to start with Business Analysis is taking a more critical look at your day job (also called Business As Usual, or BAU), and then working out how to add value.
In order to do this, you should look to identify all the tasks you do as part of your BAU, and find a way to document them. Depending how you do this there are two forms:
- Procedure
- Process Mapping
The main difference between these two is that a Procedure is a detailed written guide (maybe with screenshots or key images), think of what you’d expect to see in a user manual. Process Mapping, however, is a visual representation of the tasks, decisions, and in/outputs of a specific process or set of processes. It is these maps that we will go on to explore.
For what its worth, I’m a big fan of Process Mapping. As a visual thinker, it helps me understand the flow and links between certain tasks, that make up processes. Being able to view the “As Is” (current state) provides the opportunity to see where optimisations can be made.
As a quick aside, adding value is a very important concept in Business Analysis, or even life generally, but what value means can vary massively between people and circumstance. Think about it focused on these three interlinked features: Time, Financial, Quality;
- Time – Improving on the time taken to complete a single process or task adds up (productivity), t or allow you improve in other ways
- Financial – There may be improvements that ower costs, and/or increase profit (this may also be a knock-on effect of increased productivity)
- Quality – There may be opportunity to reduce errors, which will also improve productivity, or by capturing/providing better detail you can optimise your customer journey or marketing/business development efforts.
It may also be that improvements you identify result in added value for someone else in the organisation. So remember to think holistically about that is being improved.
The Basic Features
There are a number of process mapping formats, but lets start with the basic shapes:
- Pill – Start or End
- Direction Arrows – Show you the ‘flow’ or direction of movement
- Rectangle – Process
- Diamond – Decision
- Page – some form of document, or product of the process
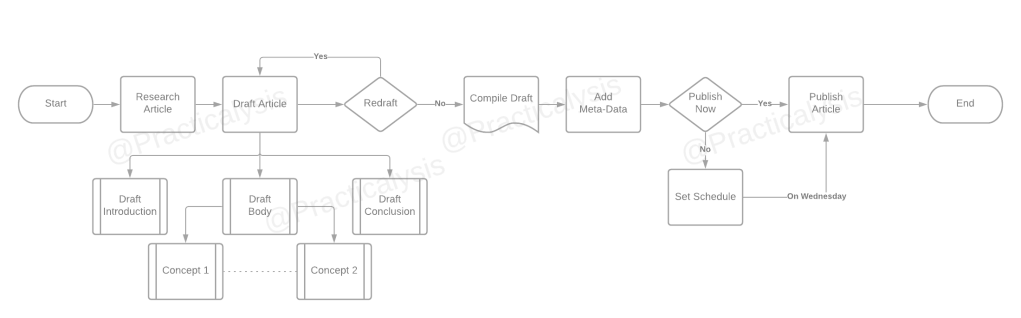
A simple example of a process using all of these is:
In the above Process Map, the flow is moving left to right.
- Make sure to fill all shapes with a description, Start and End may seem silly now, but will help when these get more complicated
- You can label arrows with additional information like timing of process e.g. wait overnight
- Processes should ideally be limited 2-3 words that list the action and thing (verb + noun) e.g. Open Email
- Decisions should include a criteria or question, and the arrows coming out should be labeled with the reason or answer
As you get used to these basic shapes, and your understanding of the mapped process improved, its possible to build out some quite complex maps still only using these basic shapes.
Next Steps
No man is an island, and the same goes for process maps. There should be some connection, either to another person or team, or a wholly separately managed process.
Including Other People
While we have discussed the shapes used, there is an additional piece of key terminology to be aware of: the space that you draw your process map in is called “a pool”, as in a swimming pool.
Off the back of that, if you want to show that processes are shared across a number of people this is done by splitting the pool, also known as adding in “swim lanes”. These are a visual barrier that show where the effort of completing a process has moved from one person to the next.
In this example, there are three swim lanes for: the customer, the cashier, the kitchen staff.
Take note, that the process boxes here are staggered, this is deliberate to show which tasks happen at the same or different times. This is really important when trying to account for delays or bottlenecks in a process.
Links To Other Processes
There are a few ways to do this, the first is that you simply expand the scope of your map i.e. find where to add in some more boxes, as data or control otherwise moves to another person.
Off-Page References
Simply put, this is the hot-potato reference. By this you are passing the responsibility for the other process to another process map (which may mean a map that someone else is responsible for making!). The off screen reference symbol looks similar to an upside-down house. Make sure to label it with the name of team, department, staff member, or process that this is linking to.
On-Page Reference
Whether or not you’ve been able to include swim lanes, you might want to show a flow or link between tasks, but a direct line may not be blocked. Trying to make an elaborate loop, or lines that cross over can look very messy or confusing. In this situation you can use an “On-Page Reference”. This is done by ending one path, with a circle, and then picking it up somewhere else, kind of like a wormhole.
Even if you only have one on-page reference, it is helpful to initial or number the item to help showing where to look next. The other main reason for labelling them, is that the format for BPMN (Business Process Mapping and Notation) Start/End and other events are shown as circles (not pill shapes) so best to avoid confusion if you go on to work in an environment that uses that standard.
BPMN has a very comprehensive set of icons that once learnt are quick to read, but are not easily understood by most people. Thats why I tried to limit the shapes here. I will do a fuller rundown of BPMN 2.0 in the future, but that is a story for another time!
Tools
Just before we finish up, Process Mapping can be performed in a number of ways. So I have made an accompanying post on the tools you can use to practice your process mapping: LINK
Summary
You now know how to:
- Start and End a process map with a pill shape
- Tasks are in boxes
- provide a brief description of what is being done
- Decisions are in diamonds
- label the options of based on reasons
- Page shapes can be used for Documents/Reports or other products of the process
- Swim Lanes to show links to other people, or roles
- Use On-Page and Off-Page references to show links to other areas
Don’t forget to check out the Tools section for options on how to start your process mapping!

Leave a reply to Process Mapping Tools – Practicalysis Cancel reply